BLOG
Shopfloor Visibility for Beckhoff PLCs

Lukas Pechhacker
Introduction:
The ability to monitor, analyze, and visualize real-time data from the shop floor can provide invaluable insights into manufacturing processes. In this blog post, we will explore our industrial IoT software solution that combines the efficiency of a time series database and the dynamic visualization capabilities of Grafana to visualize variables from Beckhoff TwinCAT 3 PLCs. Let's delve into how this seamless integration improves data handling on the shop floor and the benefits it brings to modern manufacturing.
Use our step by step guide and learn how to leverage the power of hopit to create a dashboard.
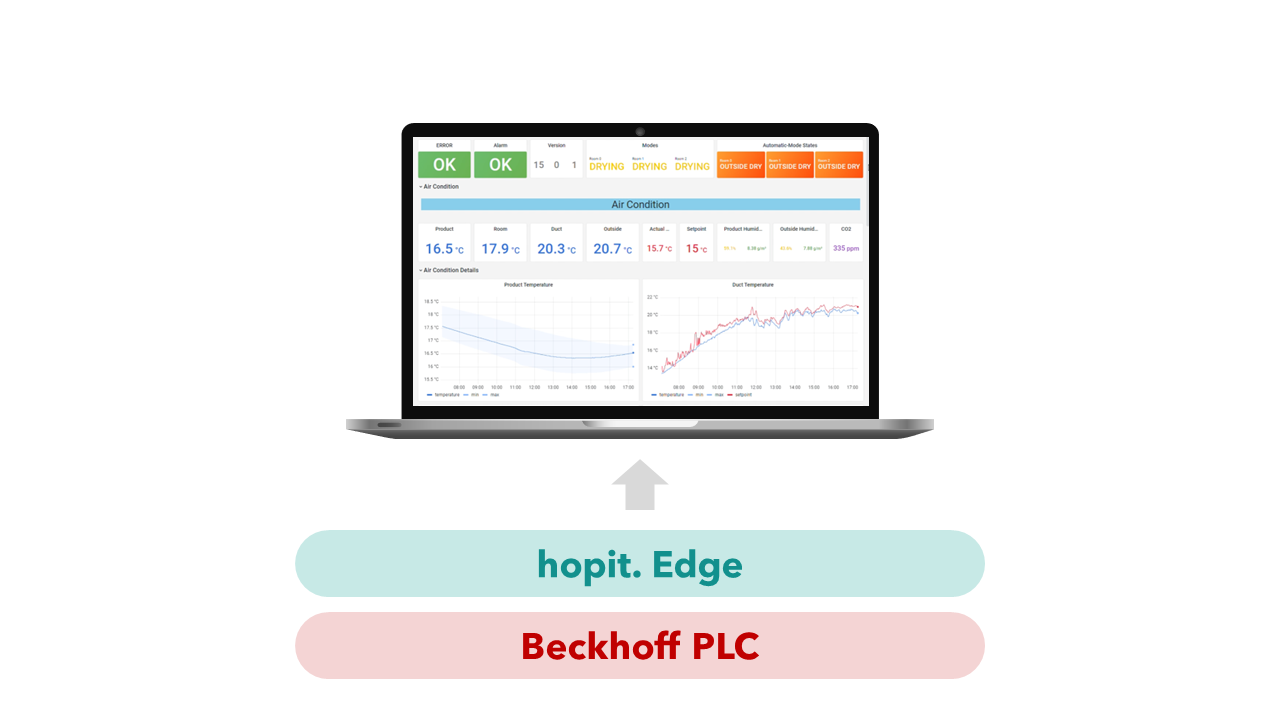
hopit Edge is the Foundation for Storing and Visualizing PLC Data
To efficiently store and retrieve time-stamped data from the Beckhoff TwinCAT 3 PLC, a powerful time series database is utilized. The time series database excels in handling vast amounts of time-stamped data with precision, making it an ideal solution for storing the PLC's variables. Additionally, hopit Edge ensures reliable data communication between the TwinCAT 3 PLC and the database, creating a robust foundation for real-time data analysis.
Seamless Data Visualization with Grafana
Grafana, a leading open-source analytics and monitoring platform, complements this powerful data infrastructure. The software serves as the interface to transform raw data into visually appealing, interactive dashboards. Grafana's intuitive drag-and-drop editor allows users to effortlessly create customized dashboards that showcase real-time and historical data from the shop floor. With a rich array of visualization options, including graphs, charts, tables, and gauges, Grafana empowers users to gain actionable insights at a glance.
The Benefits of Visualizing Data from the Shop Floor
-
Real-Time Decision-Making: With data visualization, shop floor operators and managers can monitor production processes in real-time. Immediate access to critical data allows for prompt decision-making to optimize production efficiency and respond to deviations promptly.
-
Performance Optimization: Visualizing shop floor data uncovers patterns and trends that are often not apparent in raw data. Identifying bottlenecks, inefficiencies, and potential issues empowers manufacturers to fine-tune operations for maximum productivity.
-
Predictive Maintenance: By analyzing historical data, manufacturers can predict equipment failures before they occur. Visualizing predictive maintenance data in Grafana allows for proactive maintenance scheduling, reducing downtime and improving overall equipment effectiveness (OEE).
-
Quality Assurance: Tracking variables and quality metrics on Grafana dashboards ensures that product quality remains consistent. Early detection of anomalies enables swift corrective actions, minimizing the production of defective products.
-
Enhanced Collaboration: Grafana's ability to share dashboards and reports fosters collaboration among cross-functional teams. Engineers, operators, and management can access real-time data and collaborate on optimizing processes for shared success.
-
Data-Driven Continuous Improvement: Data visualization serves as a foundation for data-driven continuous improvement initiatives. Armed with insights from the shop floor, manufacturers can implement targeted improvements to achieve sustainable growth.
Conclusion: Transforming Manufacturing with Data Visualization
The seamless integration of a time series database, Beckhoff TwinCAT 3 PLC, and Grafana using hopit Edge heralds a new era of data-driven manufacturing. By visualizing variables from the shop floor in real-time, manufacturers gain unprecedented visibility into their operations. This enhanced situational awareness empowers faster, more informed decision-making and drives continuous improvement efforts. Embrace the power of data visualization on the shop floor, and unlock your manufacturing potential in the era of Industry 4.0.
Remember, the true value lies not only in collecting data but in transforming it into actionable insights. Leverage the capabilities of this integrated solution to elevate your manufacturing processes to new levels of efficiency, quality, and competitiveness in the ever-evolving landscape of modern manufacturing.
Use our step by step guide and learn how to leverage the power of hopit to create a dashboard.